

4 min
Jul 11, 2024
Indicators
The RSI Indicator
The RSI Indicator
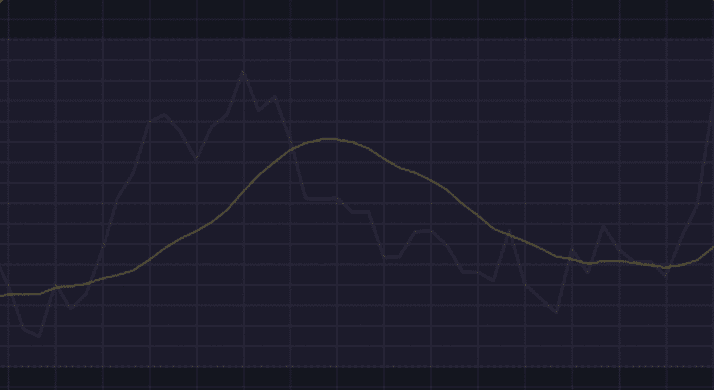
The RSI (Relative Strength Index) is a technical indicator that assesses the strength of a trend in the price of a financial asset. The goal is to identify overbought or oversold conditions in a market. Without going into the calculation details, the indicator uses the average of gains and losses over the last N candles to understand which force is more dominant: bullish or bearish. The RSI value ranges between 0 and 100. If the RSI is above 70, it is considered an overbought condition. Conversely, if the RSI is below 30, it indicates an oversold condition. Additionally, it is important to note that the RSI is often combined with other indicators to obtain more precise market entry and exit signals.


Lucas Inglese
Lucas Inglese
Trading Instructor
The RSI Block Configuration
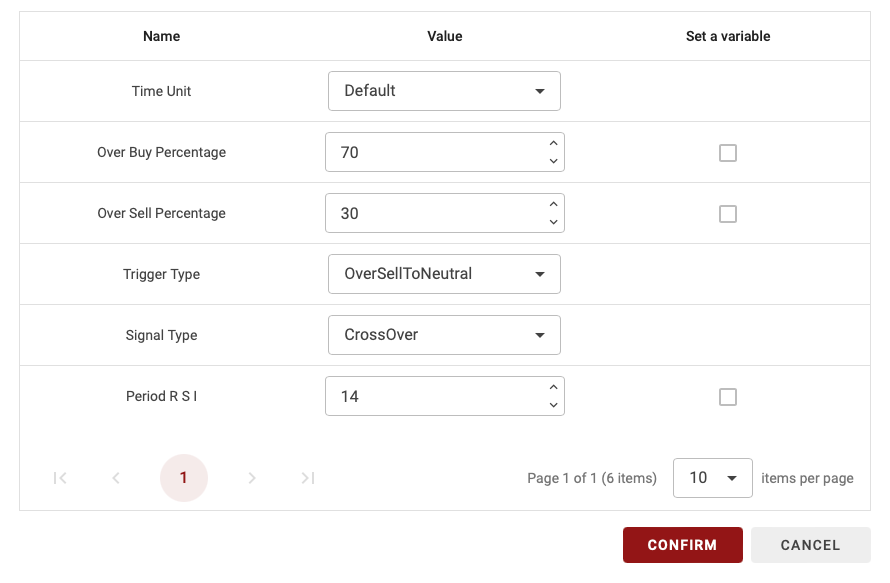
On BullTrading, you have numerous options to configure each block to make it unique. In this block, you can define the time unit, overbought and oversold thresholds, and more.
Time Unit
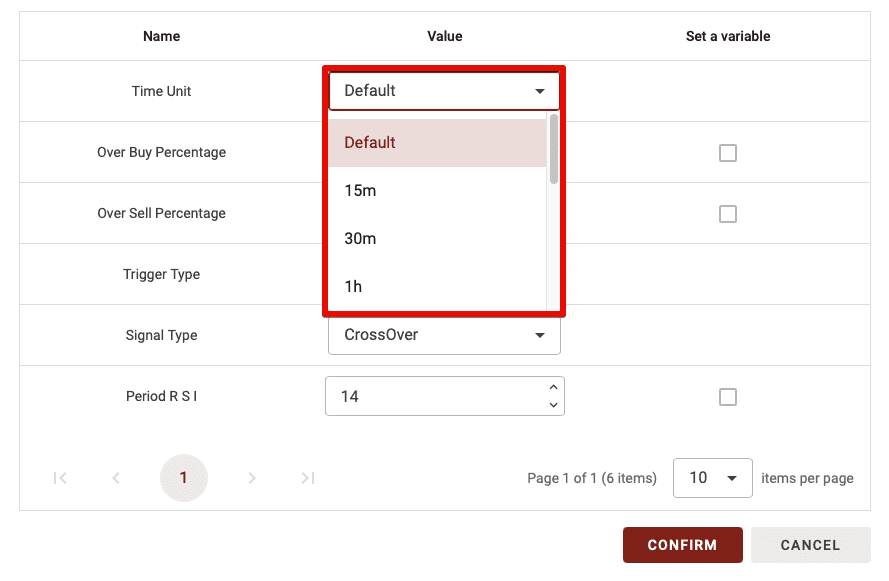
Since BullTrading allows you to create a multi-frame strategy, you can select the time period for calculating this indicator. You have two options:
Default: If you leave it as Default, the time unit will vary based on the time frame you use in the backtest.
15m, 30m, 1d, etc.: If you choose a specific time unit, this setting will be applied regardless of the time frame used in your strategy’s backtest.
TIPS: If you’re a beginner, I recommend leaving the time unit on Default.
OverBuy Percentage
The second parameter is the overbought threshold. This defines the strength level above which a situation is considered overbought.
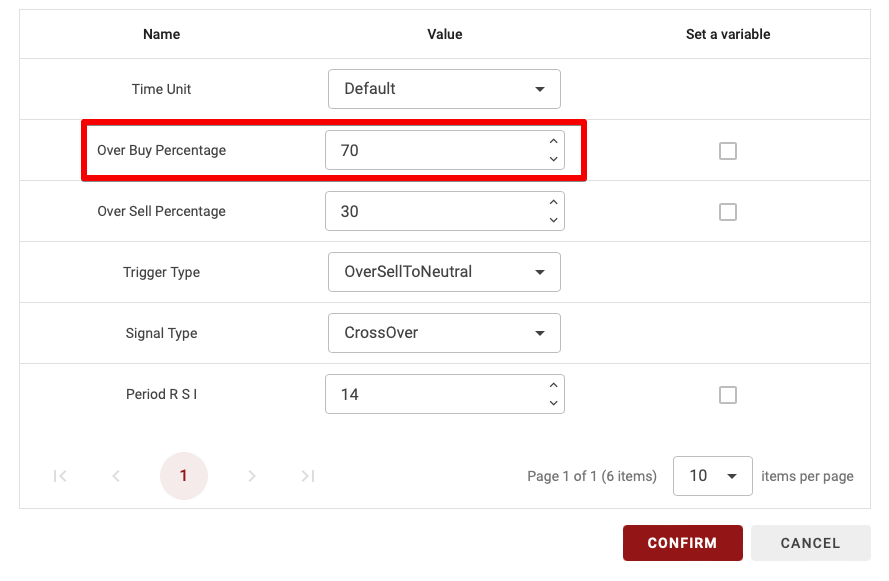
TIPS: Only whole numbers (no decimals) are allowed.
OverSell Percentage
This parameter sets the oversold threshold, defining the strength level below which a situation is considered oversold.
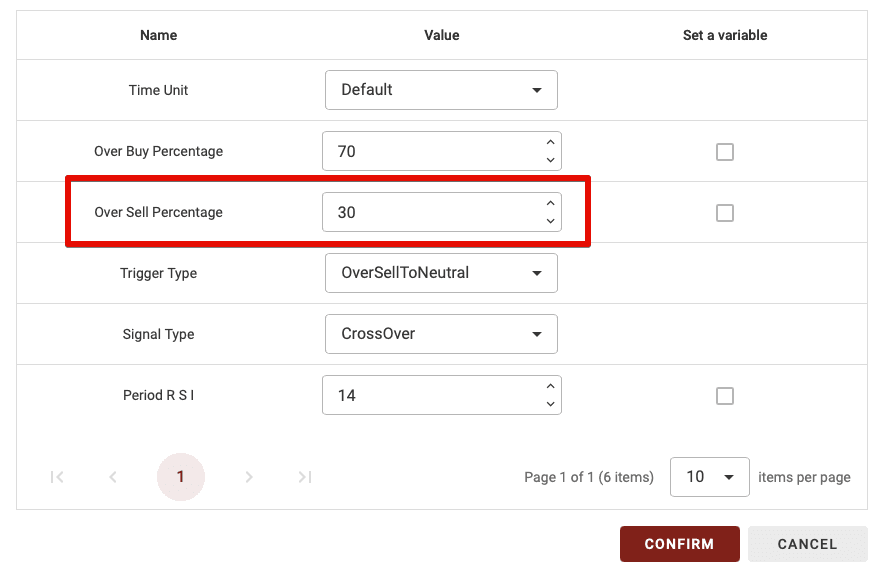
TIPS: Only whole numbers (no decimals) are allowed.
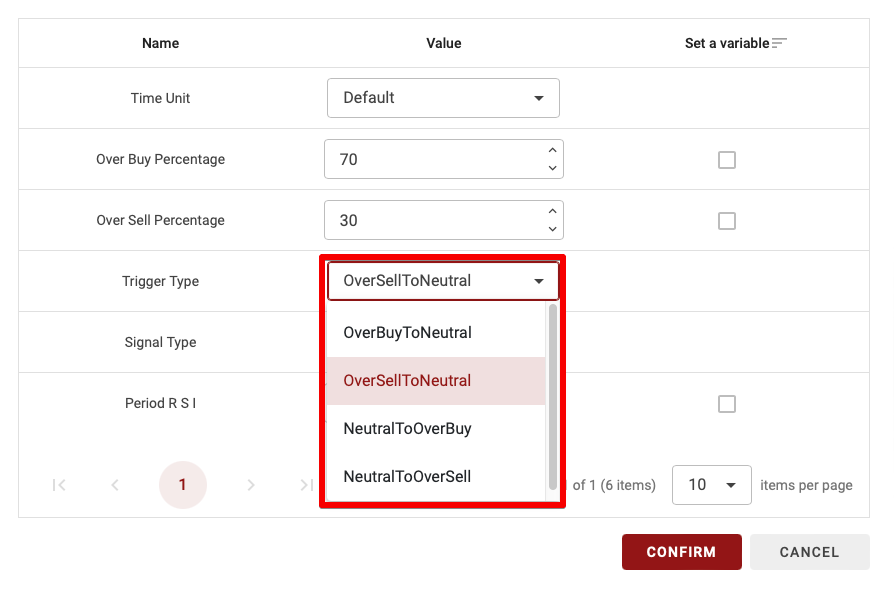
Trigger Type
This parameter has several options: OverBuyToNeutral, OverSellToNeutral, NeutralToOverBuy, NeutralToOverSell. Here’s the difference:
OverBuyToNeutral: When using this trigger, a signal occurs when you move from an OverBuy zone (above the OverBuy Percentage) to Neutral (the zone between overbought and oversold areas).
OverSellToNeutral: Similar to the previous option but indicates a move from the oversold zone to the neutral zone.
NeutralToOverBuy: This commonly used trigger activates the block when moving from the neutral zone to the overbought zone.
NeutralToOverSell: This trigger activates the block when moving from the neutral zone to the oversold zone.
Signal Type (Type de signal)
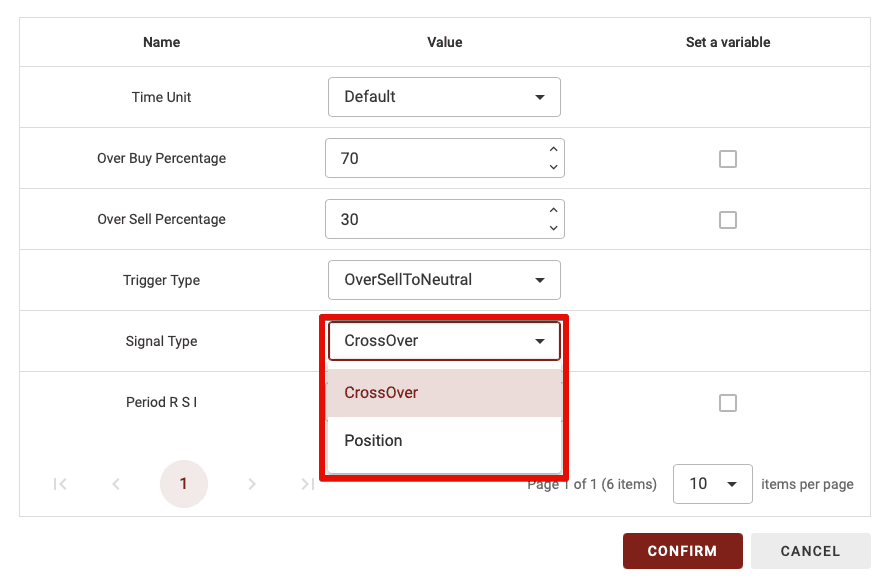
This parameter has two options: CrossOver and Position. Here’s the difference:
CrossOver: If you select CrossOver as the signal type, this block will only validate when there is a transition from one zone to another after crossing the overbought or oversold threshold.
Position: With this option, the block is validated whenever in the selected zone. For example, if in the neutral zone and coming from the overbought zone, regardless of the RSI value, the block is validated (since it confirms being in the desired zone).
TIPS: The CrossOver parameter is much more restrictive, making it useful when combining only one or two indicators. However, using too many blocks set to CrossOver can significantly reduce the number of trades in your strategy, as it requires, for example, a crossover between the two MAs + a crossover with the RSI 70 threshold + a crossover in the Vortex indicator.
So, if you’re a beginner, avoid setting more than one or two blocks to CrossOvers when combining multiple indicator blocks.
Period RSI
The final parameter represents the period used to calculate the RSI indicator, indicating how many candles back will be considered.
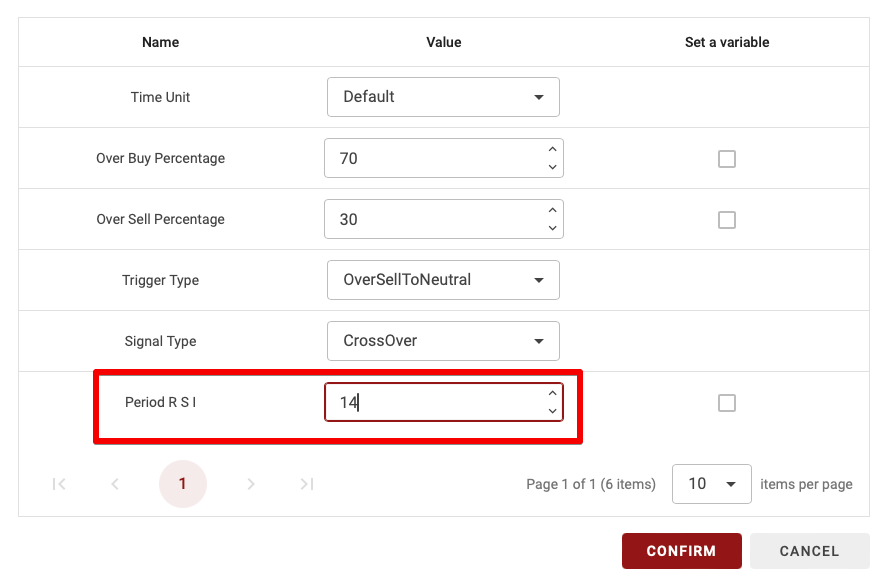
TIPS: Only whole numbers (no decimals) are allowed.
The RSI Block Configuration
On BullTrading, you have numerous options to configure each block to make it unique. In this block, you can define the time unit, overbought and oversold thresholds, and more.

Time Unit

Since BullTrading allows you to create a multi-frame strategy, you can select the time period for calculating this indicator. You have two options:
Default: If you leave it as Default, the time unit will vary based on the time frame you use in the backtest.
15m, 30m, 1d, etc.: If you choose a specific time unit, this setting will be applied regardless of the time frame used in your strategy’s backtest.
TIPS: If you’re a beginner, I recommend leaving the time unit on Default.
OverBuy Percentage
The second parameter is the overbought threshold. This defines the strength level above which a situation is considered overbought.

TIPS: Only whole numbers (no decimals) are allowed.
OverSell Percentage
This parameter sets the oversold threshold, defining the strength level below which a situation is considered oversold.

TIPS: Only whole numbers (no decimals) are allowed.
Trigger Type
This parameter has several options: OverBuyToNeutral, OverSellToNeutral, NeutralToOverBuy, NeutralToOverSell. Here’s the difference:
OverBuyToNeutral: When using this trigger, a signal occurs when you move from an OverBuy zone (above the OverBuy Percentage) to Neutral (the zone between overbought and oversold areas).
OverSellToNeutral: Similar to the previous option but indicates a move from the oversold zone to the neutral zone.
NeutralToOverBuy: This commonly used trigger activates the block when moving from the neutral zone to the overbought zone.
NeutralToOverSell: This trigger activates the block when moving from the neutral zone to the oversold zone.

Signal Type (Type de signal)
This parameter has two options: CrossOver and Position. Here’s the difference:
CrossOver: If you select CrossOver as the signal type, this block will only validate when there is a transition from one zone to another after crossing the overbought or oversold threshold.
Position: With this option, the block is validated whenever in the selected zone. For example, if in the neutral zone and coming from the overbought zone, regardless of the RSI value, the block is validated (since it confirms being in the desired zone).

TIPS: The CrossOver parameter is much more restrictive, making it useful when combining only one or two indicators. However, using too many blocks set to CrossOver can significantly reduce the number of trades in your strategy, as it requires, for example, a crossover between the two MAs + a crossover with the RSI 70 threshold + a crossover in the Vortex indicator.
So, if you’re a beginner, avoid setting more than one or two blocks to CrossOvers when combining multiple indicator blocks.
Period RSI
The final parameter represents the period used to calculate the RSI indicator, indicating how many candles back will be considered.

TIPS: Only whole numbers (no decimals) are allowed.
The RSI Block Configuration
On BullTrading, you have numerous options to configure each block to make it unique. In this block, you can define the time unit, overbought and oversold thresholds, and more.

Time Unit

Since BullTrading allows you to create a multi-frame strategy, you can select the time period for calculating this indicator. You have two options:
Default: If you leave it as Default, the time unit will vary based on the time frame you use in the backtest.
15m, 30m, 1d, etc.: If you choose a specific time unit, this setting will be applied regardless of the time frame used in your strategy’s backtest.
TIPS: If you’re a beginner, I recommend leaving the time unit on Default.
OverBuy Percentage
The second parameter is the overbought threshold. This defines the strength level above which a situation is considered overbought.

TIPS: Only whole numbers (no decimals) are allowed.
OverSell Percentage
This parameter sets the oversold threshold, defining the strength level below which a situation is considered oversold.

TIPS: Only whole numbers (no decimals) are allowed.
Trigger Type
This parameter has several options: OverBuyToNeutral, OverSellToNeutral, NeutralToOverBuy, NeutralToOverSell. Here’s the difference:
OverBuyToNeutral: When using this trigger, a signal occurs when you move from an OverBuy zone (above the OverBuy Percentage) to Neutral (the zone between overbought and oversold areas).
OverSellToNeutral: Similar to the previous option but indicates a move from the oversold zone to the neutral zone.
NeutralToOverBuy: This commonly used trigger activates the block when moving from the neutral zone to the overbought zone.
NeutralToOverSell: This trigger activates the block when moving from the neutral zone to the oversold zone.

Signal Type (Type de signal)
This parameter has two options: CrossOver and Position. Here’s the difference:
CrossOver: If you select CrossOver as the signal type, this block will only validate when there is a transition from one zone to another after crossing the overbought or oversold threshold.
Position: With this option, the block is validated whenever in the selected zone. For example, if in the neutral zone and coming from the overbought zone, regardless of the RSI value, the block is validated (since it confirms being in the desired zone).

TIPS: The CrossOver parameter is much more restrictive, making it useful when combining only one or two indicators. However, using too many blocks set to CrossOver can significantly reduce the number of trades in your strategy, as it requires, for example, a crossover between the two MAs + a crossover with the RSI 70 threshold + a crossover in the Vortex indicator.
So, if you’re a beginner, avoid setting more than one or two blocks to CrossOvers when combining multiple indicator blocks.
Period RSI
The final parameter represents the period used to calculate the RSI indicator, indicating how many candles back will be considered.

TIPS: Only whole numbers (no decimals) are allowed.


Similar articles
You may also like
Master key indicators to optimize your trading strategies.


Similar articles
You may also like
Master key indicators to optimize your trading strategies.


Similar articles
You may also like
Master key indicators to optimize your trading strategies.
Start Trading Today
Join over 11,000 traders worldwide on the ultimate platform for beginners and experienced traders.
Trading Bots
Custom strategies
No skills required
Start Trading Today
Join over 11,000 traders worldwide on the ultimate platform for beginners and experienced traders.
Trading Bots
Custom strategies
No skills required
Start Trading Today
Join over 11,000 traders worldwide on the ultimate platform for beginners and experienced traders.
Trading Bots
Custom strategies
No skills required
